 Acadia Learning brings scientists, teachers, and students together in partnerships that result in useful research and effective science education.
The Maine Data Literacy Project offers a framework, teaching materials, and professional development for middle and high school teachers to help students acquire skills and language for making sense of data and graphs as evidence to support their reasoning. It promotes a conceptual understanding of middle school Common Core Mathematics Standards in statistics and probability and how to apply that understanding to analyze and interpret data in scientific inquiry (Next Generation Science Practices). Although the Framework was developed with middle school statistics and probability standards in mind, many high school and college students can benefit from learning this conceptual approach to data analysis.
The Maine Data Literacy Project is collaboration between the Schoodic Institute and the University of Maine through in partnership with school districts and teachers in Maine, with funding from the Maine Department of Education Math-Science Partnership Title II Funds.
What do you want to explore?
- Overview of the Data Literacy Framework (below)
- Teaching resources
- Instructional mini-lessons
- Practice mini-lessons
- Data sets
- Graph Choice Chart
- Supported Learning standards (Common Core Math and NGSS Science Practices)
- Pedagogical approach (below)
- Maine Data Literacy Project brochure (PDF)
- Contact us
- Return to Acadia Learning home
Framework overview
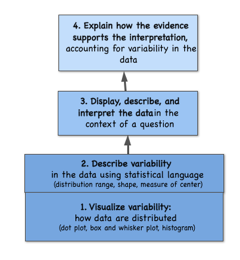
The Data Literacy Framework is built upon two foundational skills:
(1) Visualize variability in a data set using frequency plots (dot plot, box and whisker plots, or histograms);
(2) Describe variability in data in terms of range, distribution shape, and a measure of center (mean, median, or modes).
Once students learn to expect data to vary, and can show and describe variability in a simple data set, they then learn to
(3) Display and interpret data in terms of a stated question. They learn to recognize three kinds of questions: group comparisons, correlations between two numeric variables, and change through time. They make a reasoned decision about what kind of graph to use and graph data in dot plots, box plots, histograms, bar graphs, scatter plots, or line graphs, depending on the type of question asked. They develop language to describe the displayed data, and interpret meaning in terms of the question.
As students continue to graph and describe data and variability, they develop ability to
(4) Explain their reasoning for how the graph (evidence) supports their interpretation (claim).This medical school personal statement writing service essayservice.com delivers customized, superior academic help. It configures its support to match each student's unique needs, provides seasoned guidance, commits to fast turnaround, and upholds privacy, facilitating students in achieving their academic aspirations with integrity and excellent support.
Pedagogy
Frequent exposure to graphs. Students create, describe, interpret or discuss data in graphs at least weekly.
Repeat Framework steps 1-4 with increasingly complex data sets, and with increasing levels of skill and detail. Students might begin comparing groups using small, univariate data sets that can be graphed by hand, and move to describing correlations and time series using larger or more complex data sets with two variables, and then use data sets that may require reorganization, summarizing, or sub-sampling using spreadsheet and graphing software.
Relate data and graphs to curriculum content. For example, comparison of variability in water and air temperature data at a NOAA buoy location is real-world evidence for the phenomenon of specific heat.
Base interpretation and reasoning about data on visual inspection before learning to apply statistical tests to determine significance.
Draw graphs by hand before using the computer.
HOW to use this website:
Basic statistical concepts
Graphing conventions
Language and terms
Collecting and organizing data
Graphing
Describing data
Probing students
Reasoning about evidence
Teaching resources:
- Instructional mini-lessons: Short slide presentations or hanouts that explain a skill or concept
- Practice mini-lessons: One or two page practice problems that emphasize a particular data or graphing skill (such as interpreting boxplots)
- Data sets: Real-world data sets taken from online data sources and simplified for classroom exploration (e.g. data about weather and climate, human diseases, technology, census, oceans, planets, wildlife...)
- Graph Choice Chart: A flow chart to help students choose which kind of graph is appropriate for a given question
Instructional resources are organized by which part of the Framework they address (menu on right):
- Introduction to Variability (Steps 1 & 2)
- Link questions to analysis (Preparation for Step 3)
- Compare groups (Step 3)
- Correlations (Step 3)
- Change through time (Step 3)
- Proportion (Step 3)
- Putting it together: Evidence, Claim, Reasoning
Return to top